
Notice
Recent Posts
Recent Comments
Link
| 일 | 월 | 화 | 수 | 목 | 금 | 토 |
|---|---|---|---|---|---|---|
| 1 | ||||||
| 2 | 3 | 4 | 5 | 6 | 7 | 8 |
| 9 | 10 | 11 | 12 | 13 | 14 | 15 |
| 16 | 17 | 18 | 19 | 20 | 21 | 22 |
| 23 | 24 | 25 | 26 | 27 | 28 | 29 |
| 30 | 31 |
Tags
- SQL코딩테스트
- 영어
- 토플공부법
- 영어기사
- 파이썬
- 의대확장
- 영어뉴스
- 영어신문
- 프로그래머스파이썬
- 코딩테스트
- SQL쿼리
- 프로그래머스
- 의대정원
- 프로그래머스코딩테스트
- 토플준비
- 미국석사
- 파이썬코딩테스트
- 영어기사읽기
- 영문법
- 파이썬코딩
- 의대정원확장
- 프로그래머스SQL
- sql
- 코린이
- 영어뉴스기사
- 토플독학
- 영어공부
- 영어표현
- 영어신문읽기
- 영어뉴스읽기
Archives
- Today
- Total
OFMY (Ony for me and you)
[EDA] Feature 시각화 본문
타깃값(0: 정상/ 1: 비정상) 에 따른 데이터 분포 확인
- Categorical (범주형 데이터)
# 이상치 유무에 따른 차이를 보기 위한 데이터 분류
train_0 = train[train['Y_LABEL']==0]
train_1 = train[train['Y_LABEL']==1]
# 'COMPONENT_ARBITRARY' #Test Feature
fig, ax = plt.subplots(1, 2, figsize=(16, 6))
sns.countplot(x = 'COMPONENT_ARBITRARY',
data = train_0,
ax = ax[0],
order = train_0['COMPONENT_ARBITRARY'].value_counts().index)
ax[0].tick_params(labelsize=12)
ax[0].set_title('anomaly = 0')
ax[0].set_ylabel('count')
ax[0].tick_params(rotation=50)
sns.countplot(x = 'COMPONENT_ARBITRARY',
data = train_1,
ax = ax[1],
order = train_1['COMPONENT_ARBITRARY'].value_counts().index)
ax[1].tick_params(labelsize=12)
ax[1].set_title('anomaly = 1')
ax[1].set_ylabel('count')
ax[1].tick_params(rotation=50)
plt.subplots_adjust(wspace=0.3, hspace=0.3)
plt.show()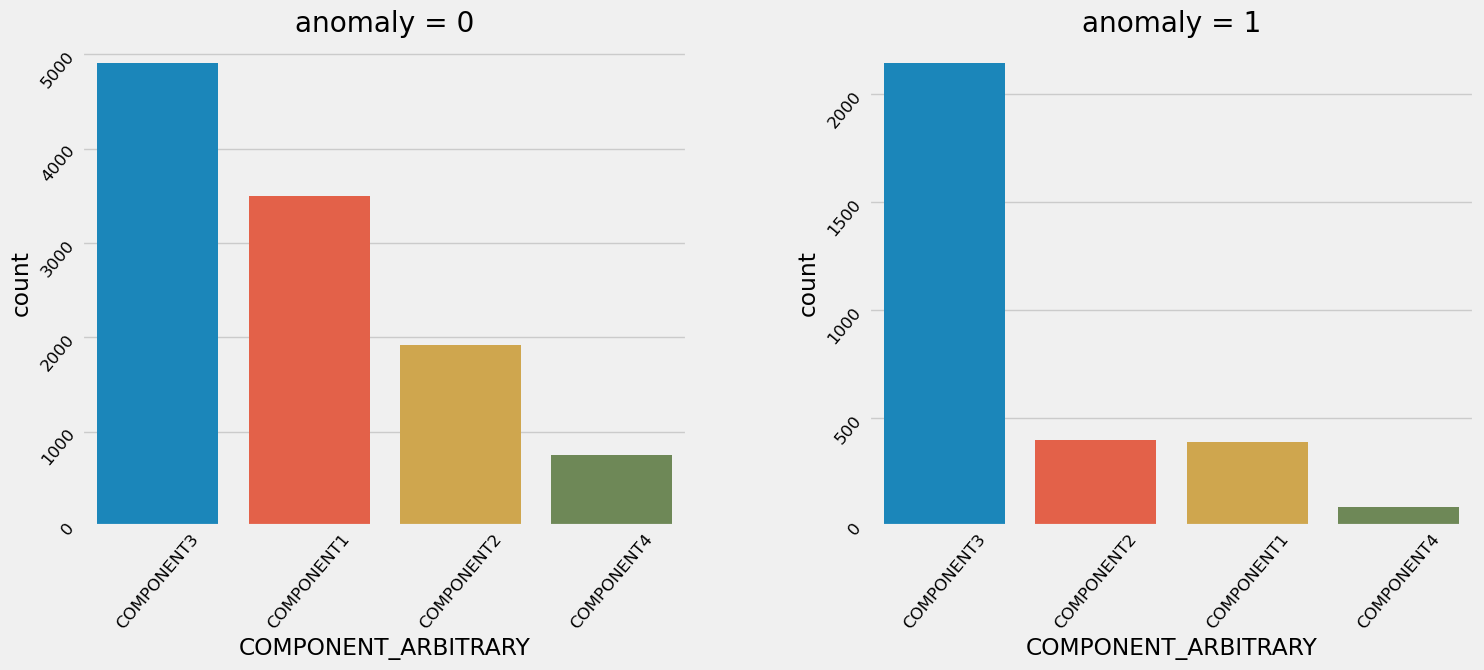
- numerical (수치형 변수)
num_plot 이라는 함수 정의 후 수치변수 대입
# Numerical 그래프 함수 정의
def num_plot(train, train_0, train_1, column):

    fig, axes = plt.subplots(1, 2, figsize=(16, 6))

    if column in test_features :
        color = 'red'
    else :
        color = 'blue'

    sns.distplot(train_0[column], color = color,
                ax = axes[0])
    axes[0].tick_params(labelsize=12)
    axes[0].set_title('anomaly = 0')
    axes[0].set_ylabel('count')
    axes[0].set_xlim(None,train[column].max())

    sns.distplot(train_1[column], color = color,
                ax = axes[1])
    axes[1].tick_params(labelsize=12)
    axes[1].set_title('anomaly = 1')
    axes[1].set_ylabel('count')
    axes[1].set_xlim(None,train[column].max())


    plt.subplots_adjust(wspace=0.3, hspace=0.3)
num_plot(train, train_0, train_1,'SAMPLE_TRANSFER_DAY')
'머신러닝 > 코드 뜯어보기' 카테고리의 다른 글
| [EDA] 타깃 분포 살펴보기 - pie차트 (0) | 2023.09.12 |
|---|---|
| [EDA] 이상치 확인하기 (0) | 2023.09.12 |
| [EDA] 데이터프레임으로 피쳐 특성 살펴보기 (0) | 2023.09.12 |
'머신러닝/코드 뜯어보기' Related Articles
more


